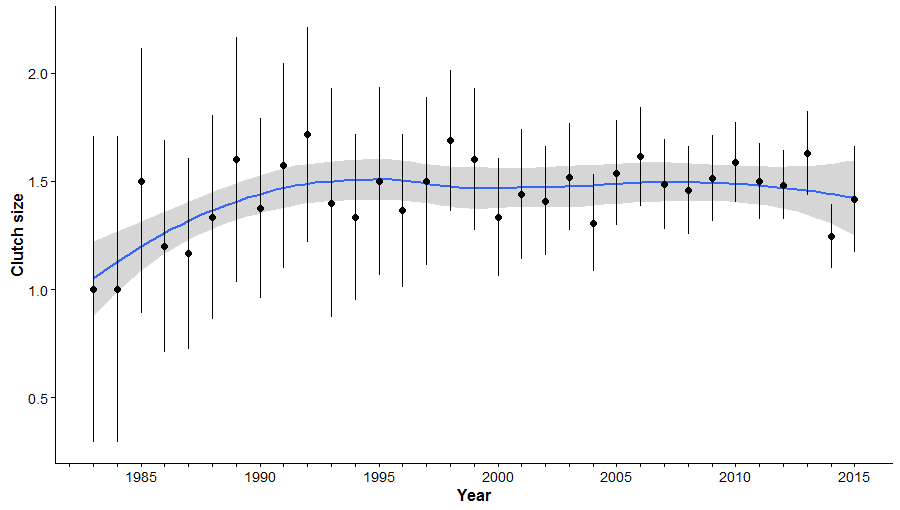
The graph above shows the national trend in the clutch size of White-tailed Eagle pairs that were confirmed to have laid at least one egg between 1983 and 2015.
| Parameter | Period | Years | Mean annual sample + SE | Type of trend | Mean + SE |
|---|---|---|---|---|---|
| Breeding pairs | 1983-2015 | 33 | NA* | Exponential increase | 27.4 ± 4.4 |
| Laying success | 1995-2015 | 21 | 38.3 ± 5.2 | Linear increase | 0.9 ± 0.0 |
| Clutch size | 1983-2015 | 33 | 20.5 ± 2.9 | Stable | 1.5 ± 0.0 |
| Hatching success | 1995-2015 | 21 | 36.7 ± 4.6 | Linear increase | 0.7 ± 0.2 |
| Brood size | 1995-2015 | 21 | 24.0 ± 3.3 | Stable | 1.5 ± 0.0 |
| Fledging success | 1985-2015 | 31 | 24.6 ± 3.9 | Linear increase | 0.6 ± 0.0 |
| Number of fledglings | 1995-2015 | 21 | 20.8 ± 3.3 | Stable | 1.4 ± 0.0 |

