")
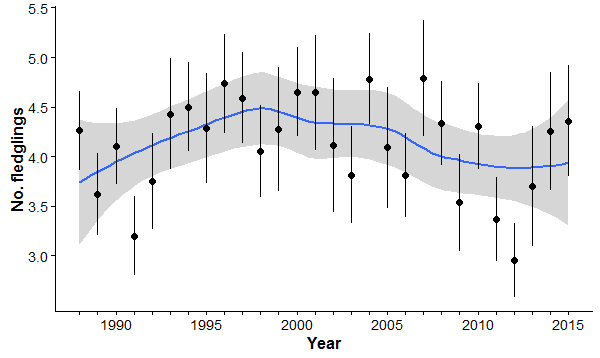
The graph above shows the trend in the minimum number of fledglings produced per successful pair of Kestrel in the Ayrshire study area between 1988 and 2015.
Parameter Period Years Mean annual sample size Type of trend Mean +SE
Breeding pairs 1988-2015 28 39.61 ± 1.04 Decreasing 25.5 (± 1.22)
Clutch size 1988-2015 28 17.57 ± 1.27 Stable 5.13 ± 0.04
Brood size 1988-2015 28 15.04 ± 1.05 Stable
4.66 ± 0.05
Fledgling success 1988-2015 28 21.29 ± 1.21 Linear increase 0.86 ± 0.01
No. fledglings 1988-2015 28 17.89 ± 0.99 Stable
4.12 ± 0.06