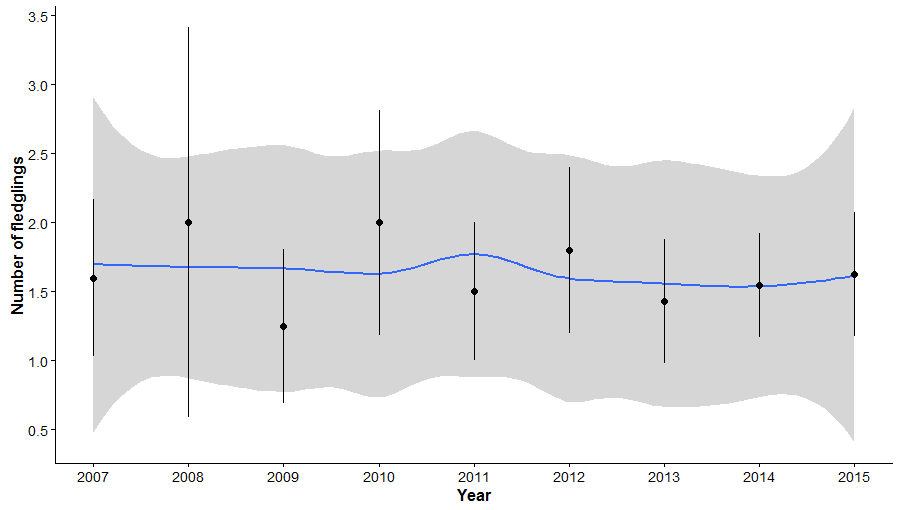
The graph above shows the trend in the minimum number of fledglings produced per successful pair of White-tailed Eagles in Lewis & Harris between 2007 and 2015.
| SRMS Region | Breeding parameter | Period | Years | Mean annual sample + SE | Trend | Mean + SE |
|---|---|---|---|---|---|---|
| Argyll | Breeding pairs | 1998 - 2015 | 18 | N/A* | Linear increase | 13.3 ± 1.9 |
| Argyll | Clutch size | 1998-2014 | 17 | 9.7 ± 1.1 | Stable | 1.6 ± 0.0 |
| Argyll | Hatching success | 2007 - 2015 | 9 | 17.6 ± 1.9 | Stable | 0.8 ± 0.0 |
| Argyll | Brood size | 2000 - 2015 | 16 | 9.9 ± 1.2 | Stable | 1.4 ± 0.4 |
| Argyll | Fledging success | 1998 - 2015 | 18 | 11.8 ± 1.7 | Linear increase | 0.7 ± 0.0 |
| Argyll | Number of fledglings | 2005 - 2015 | 11 | 11.5 ± 1.4 | Stable | 1.3 ± 0.0 |
| Highland | Breeding pairs | 1987 - 2015 | 29 | NA* | Linear increase | 14.3 ± 1.8 |
| Highland | Clutch size | 1990 - 2015 | 26 | 11.8 ± 1.3 | Stable | 1.4 ± 0.0 |
| Highland | Hatching success | 1996 - 2015 | 20 | 17.1 ± 1.5 | Stable | 0.7 ± 0.0 |
| Highland | Brood size | 1995 - 2015 | 21 | 10.2 ± 1.2 | Stable | 1.5 ± 0.0 |
| Highland | Fledging success | 1994 - 2015 | 22 | 14.6 ± 1.5 | Stable | 0.6 ± 0.0 |
| Highland | Number of fledglings | 1998 - 2015 | 18 | 9.3 ± 1.0 | Stable | 1.4 ± 0.0 |
| Lewis & Harris | Breeding pairs | 2004 - 2015 | 12 | NA* | Linear increase | 9.4 ± 1.2 |
| Lewis & Harris | Clutch size | 2005 - 2015 | 11 | 8.6 ± 1.2 | Stable | 1.5 ± 0.1 |
| Lewis & Harris | Hatching success | 2006 - 2015 | 10 | 10.2 ± 1.4 | Stable | 0.6 ± 0.1 |
| Lewis & Harris | Brood size | 2005 - 2015 | 11 | 6.1 ± 0.9 | Stable | 1.6 ± 0.1 |
| Lewis & Harris | Fledging success | 2008 - 2015 | 8 | 9.3 ± 1.3 | Linear increase | 0.6 ± 0.1 |
| Lewis & Harris | Number of fledglings | 2007 - 2015 | 9 | 5.6 ± 1.0 | Stable | 1.6 ± 0.1 |
| Uist | Breeding pairs | – | – | – | N/A** | – |
| Uist | Clutch size | – | – | – | N/A** | – |
| Uist | Hatching success | – | – | – | N/A** | – |
| Uist | Brood size | – | – | – | N/A** | – |
| Uist | Fledging success | – | – | – | N/A** | – |
| Uist | Number of fledglings | – | – | – | N/A** | – |

